


Download, slice and print this model in the MakerSpell app — available on Android and Windows. Get the app
Model Overview & Print Notes
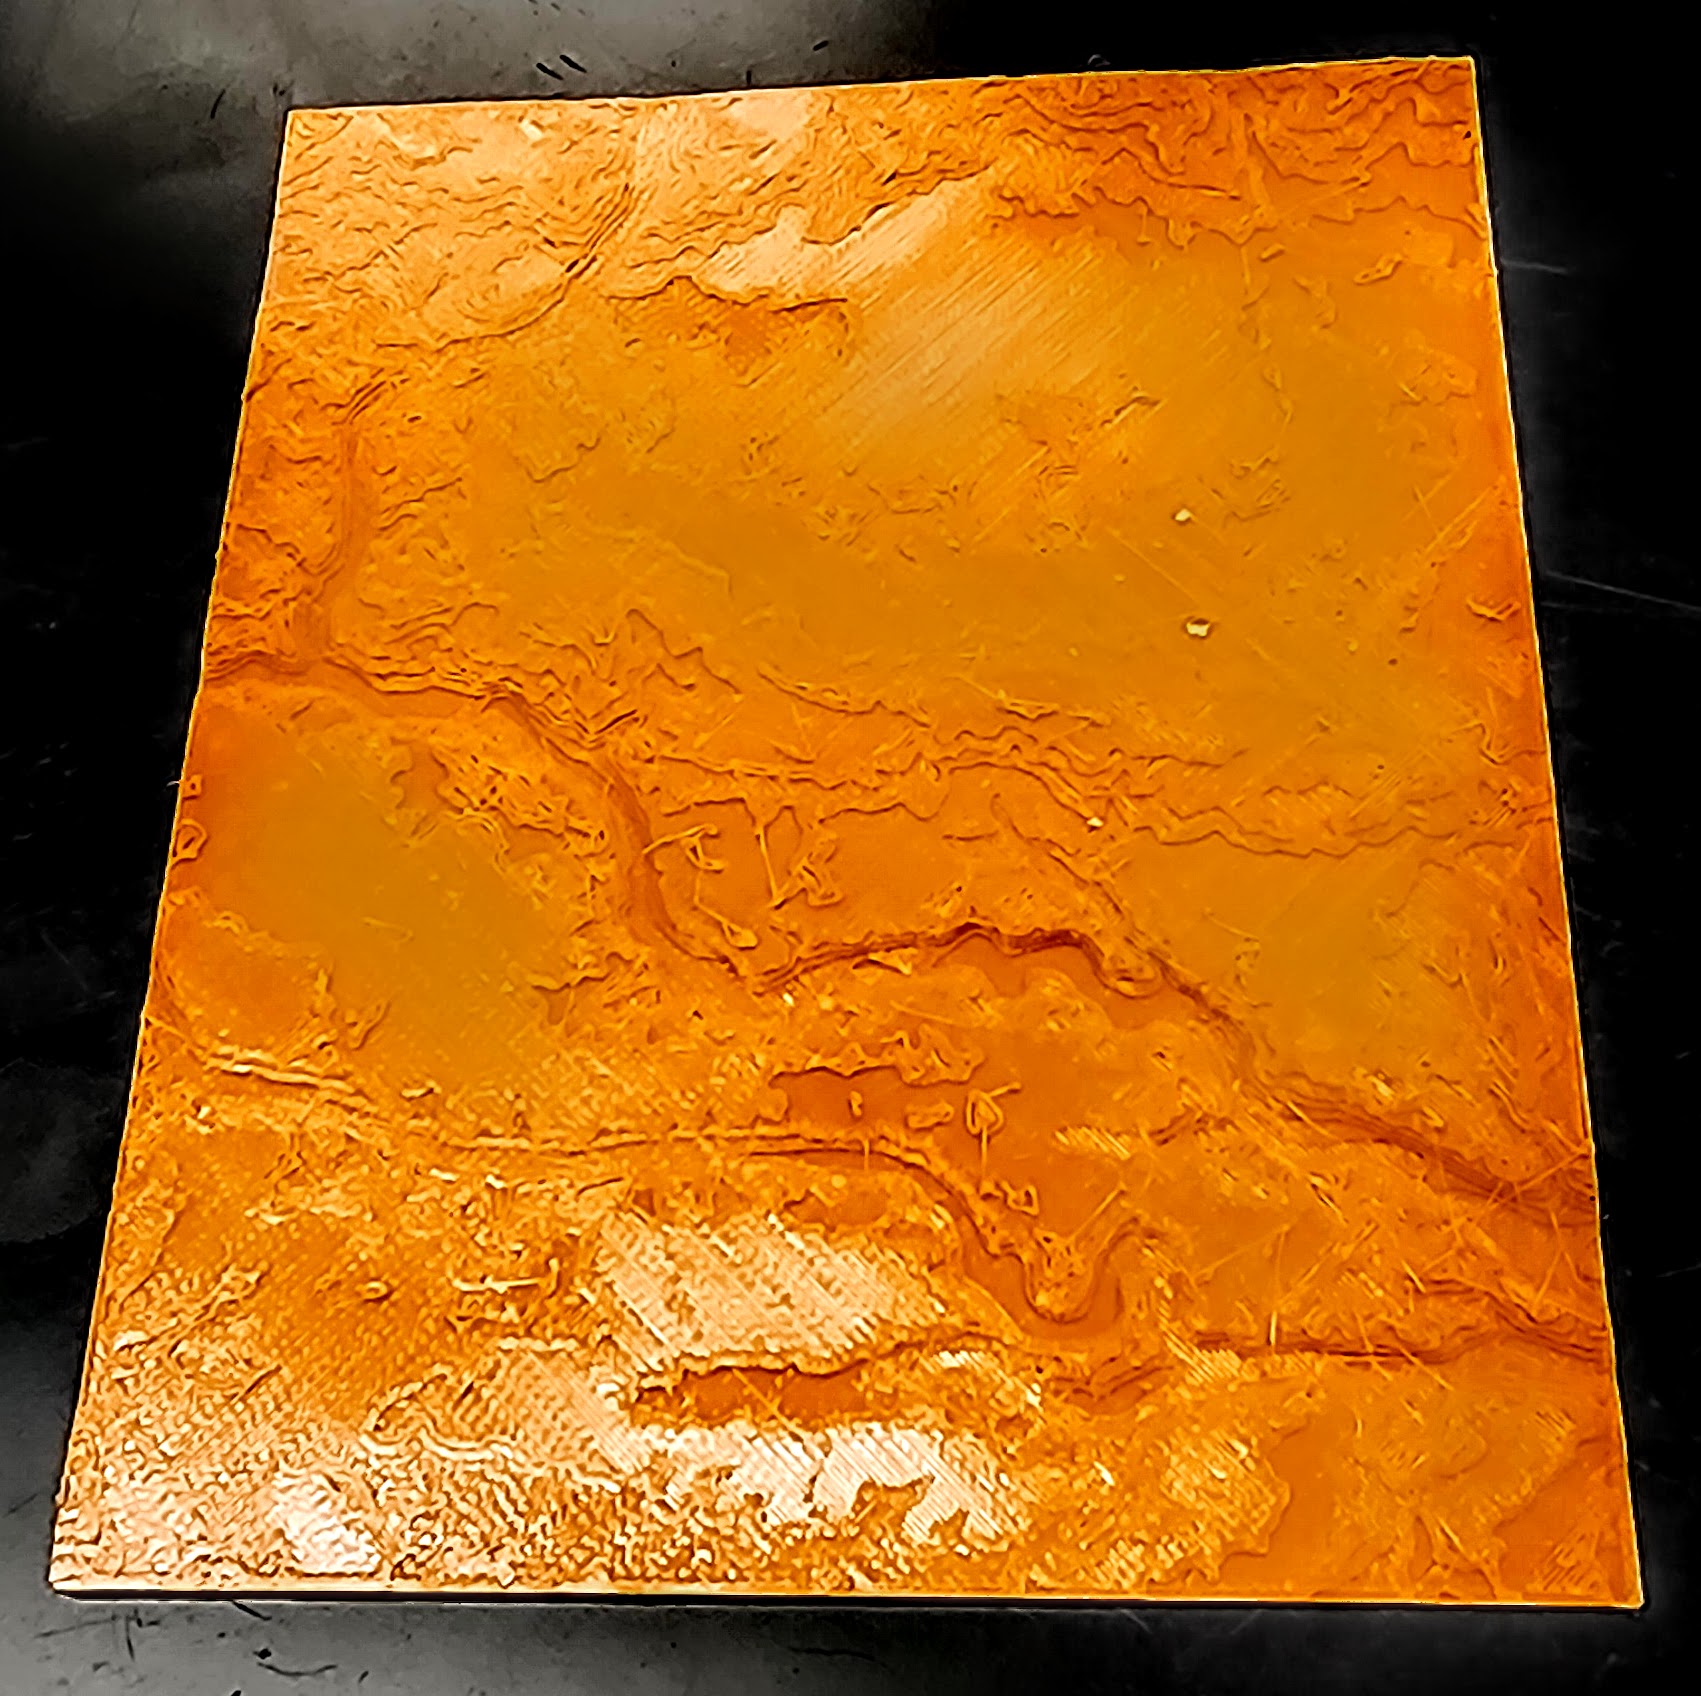
I've tried several sites to generate my own topographic maps including, but not limited to: TopoTopo (now defunct) and Terrain2STL , but they never had much detail and could be hard to pinpoint precise locations and could be vague on the printing scale. There are plenty of topographic map models available, but often at an inconsistent scale or lacking detail. This is more a spinoff than a remix of the original, but the original poster Ignis Veneficus shared a model created with TouchTerrain . I used it to print the USGS 7.5' Versailles Quadrangle, Ohio Topographic Map, which is where I teach. I've printed a no exaggeration and x5 vertical exaggeration version. To print your own for a specific location: Go to TouchTerrain . I didn't modify anything in the Terrain Settings box, but most of those only affect the on-screen view and not your print. Open the Area Selection Box . This will allow you to type in the top right & lower left corner coordinates. Use the USGS Topographic map that you are interested in printing and match the corner coordinates. There are many ways to access the map you are interested in, but I prefer to use this USGS service to search for and then download the relevant map(s). Then in the 3D Printer Options box you can set the width. This will then set the horizontal and vertical scale. USGS 7.5' Quadrangle Topographic Maps have a scale of 1:24,000. The default 3D printer file is 100 mm wide. The 7.5' Quadrangles use latitude and longitude lines and so while they all have the same angular dimensions, they have different length dimensions at different latitudes. The area can be 49-71 mi². At the equator this would be about 8.4 mi wide. This gives an approximate horizontal scale of 1 mm = 444 feet or just under 1/10th mile. The default model base thickness is 1 mm. This could be adjusted to account for the height above sea-level. Again the linear scale varies since longitude lines are not parallel and the Earth is a sphere. However, if we take the 444 feet = 1 mm, then simply your height above sea-level (in feet) divided by 444 would give the base an approximate thickness that matches the height above sea-level. TinyMtn has many models of mountains available for printing and they have 2 versions of each - one with a generic, standard sized base and another where the base is scaled to the appropriate thickness to match sea-level height. I recommend looking at their Everest model . Everest is the highest elevation on Earth, but it is not the tallest mountain since it sits on a plateau. If you live in a very flat area then the relief will nit be great. An option to overcome this is to take advantage of the vertical exaggeration. Vertical exaggeration takes the horizontal scale and multiplies it by whatever factor you pick. For example if horizontally 1 mm =444 feet at x2 exaggeration 1 mm = 222 feet. This may sound backwards, but what it means is an original 1 mm rise is now 2 mm tall. If you do any vertical exaggeration and you are using the sea-level idea above, be sure to compensate for the exaggeration by multiplying the thickness by that value too. I've attached a photo of the prints of where I teach ( USGS 7.5-minute Versailles Quadrangle, Ohio Topographic Map ), which I printed at no & x5 exaggeration (the photo is x5 exaggeration). Now, I wish I had read the original poster's description in more detail. He suggested printing in alternate colors: “I printed it with 0.05 layer height, and from every 10 layer 2 with different color (black), in this case every mm contains 2 contour line.” Basically every 10 layers he changed colors from green to black to give it the appearance of a contour map. This could be modified to do brown every x layers and black every y layers (or the like) which could give the appearance of the regular and bold contour lines on a standard USGS map. The frequency of color change will vary based on the vertical exaggeration chosen and will take a little math to calculate. When I reprint (or print new ones) I will try to work out the math and update this post. Please leave a comment if you make your own or if there's any questions. I'd love to see which variations and locales are printed. Sharing the file or posting your own model as a remix would be greatly appreciated too.
💬Baskı İncelemeleri & Yorumlar(0)
★4.9 / 5.0· Başarılı Baskı